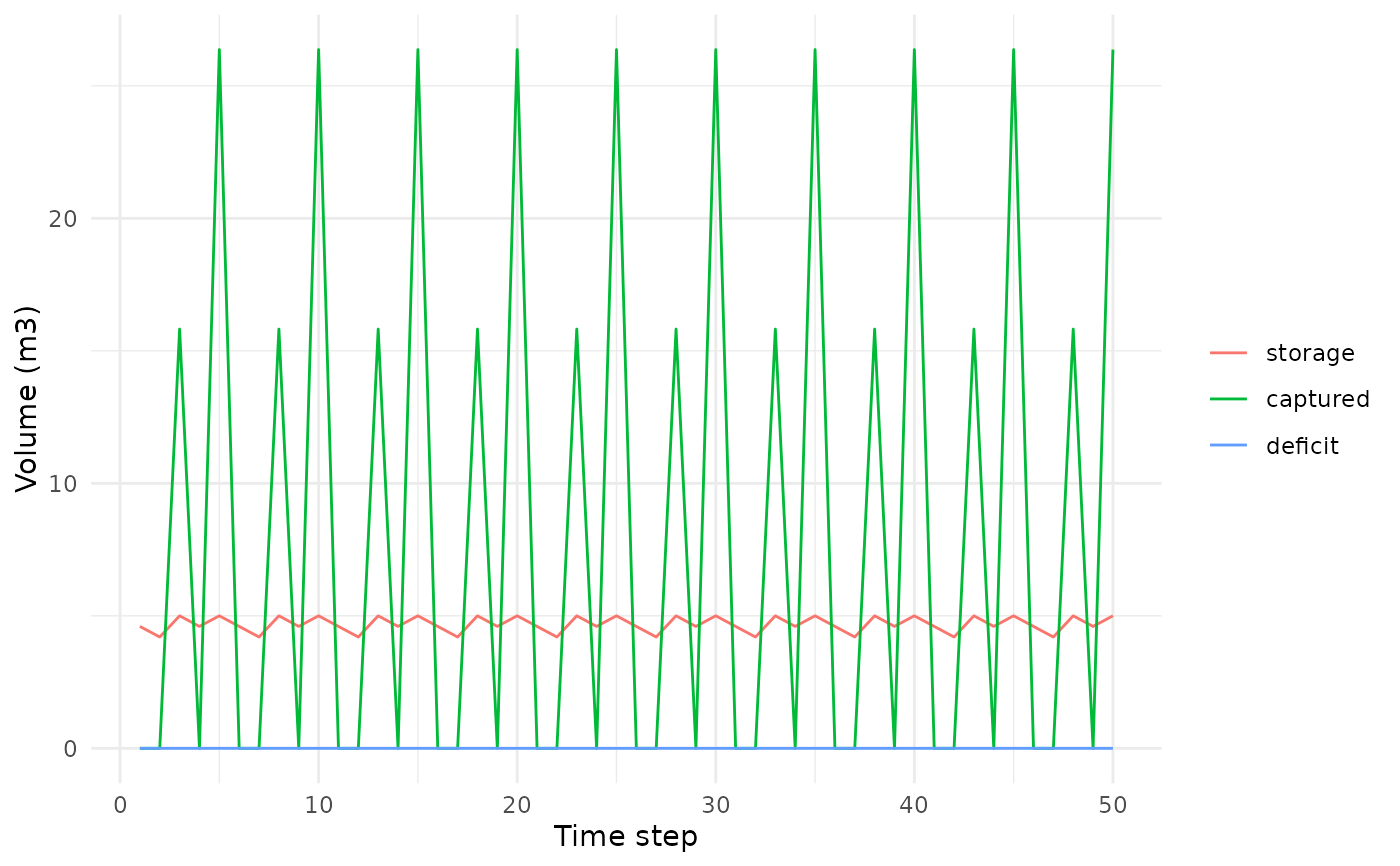
Draws the daily series of a rh_simulate() result: reservoir storage,
captured volume (inflow) and deficit over time. Requires the ggplot2
package.
Arguments
- object, x
A
rharv_simobject fromrh_simulate().- vars
Character vector of series to draw; any of
"storage","captured","overflow","supplied","deficit". Defaults to storage, captured and deficit.- ...
Passed on (currently unused).
Examples
sim <- rh_simulate(rep(c(0, 0, 30, 0, 50), 10), demand = 0.4,
                   area = 775.53, capacity = 5)
if (requireNamespace("ggplot2", quietly = TRUE)) {
  ggplot2::autoplot(sim)
}