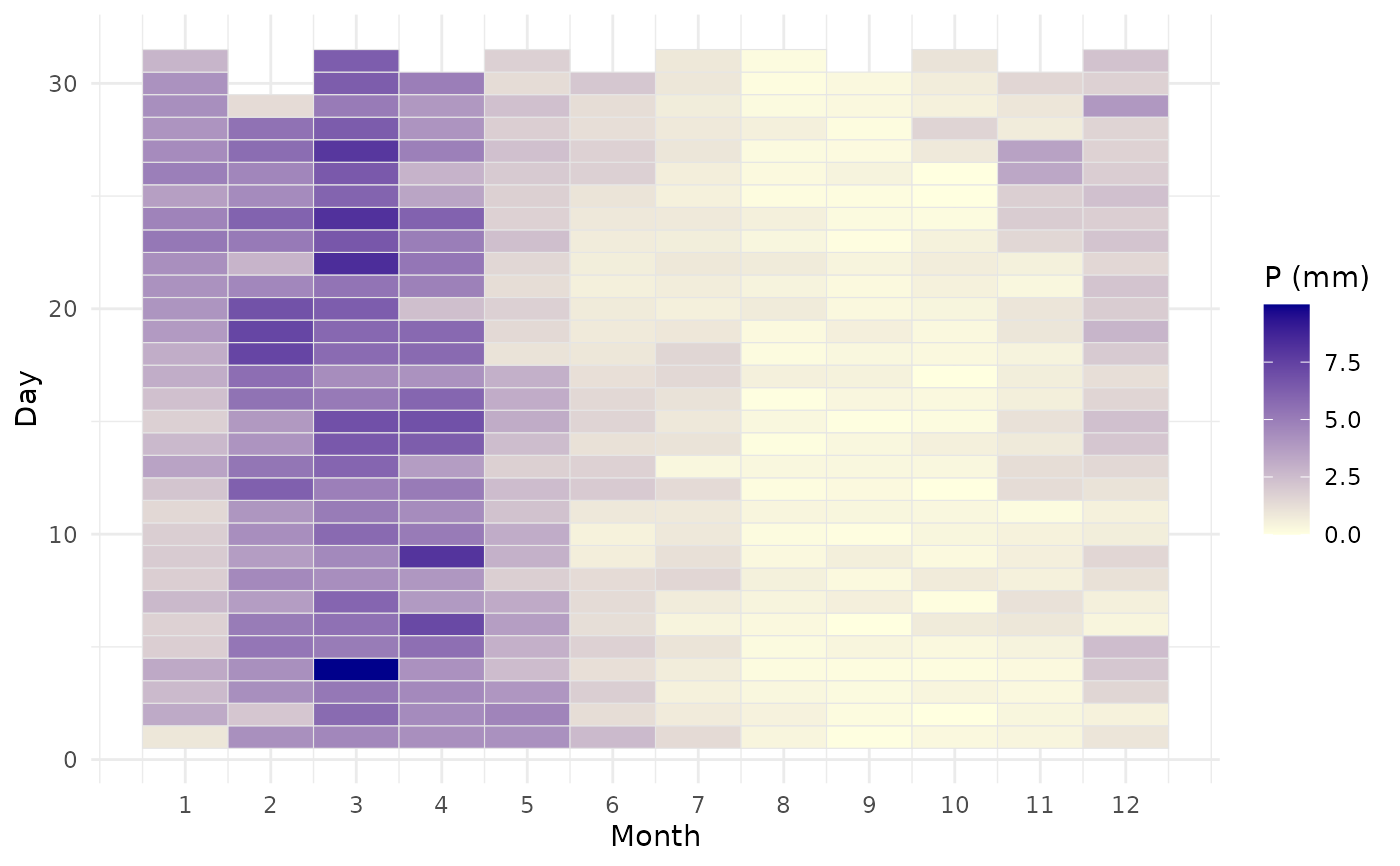
Aggregates a daily precipitation series to a month-by-day climatology and draws it as a tile heatmap (the "precipitation matrix"). Requires the ggplot2 package.
Arguments
- data
A data frame with a date column and a value column.
- date_col, value_col
Column names (strings) holding the dates and the precipitation values. Default
"date"and"value".- fun
Aggregation function applied per calendar day across years. Default
mean().
Examples
if (requireNamespace("ggplot2", quietly = TRUE)) {
  rh_plot_climatology(precip_pi)
}