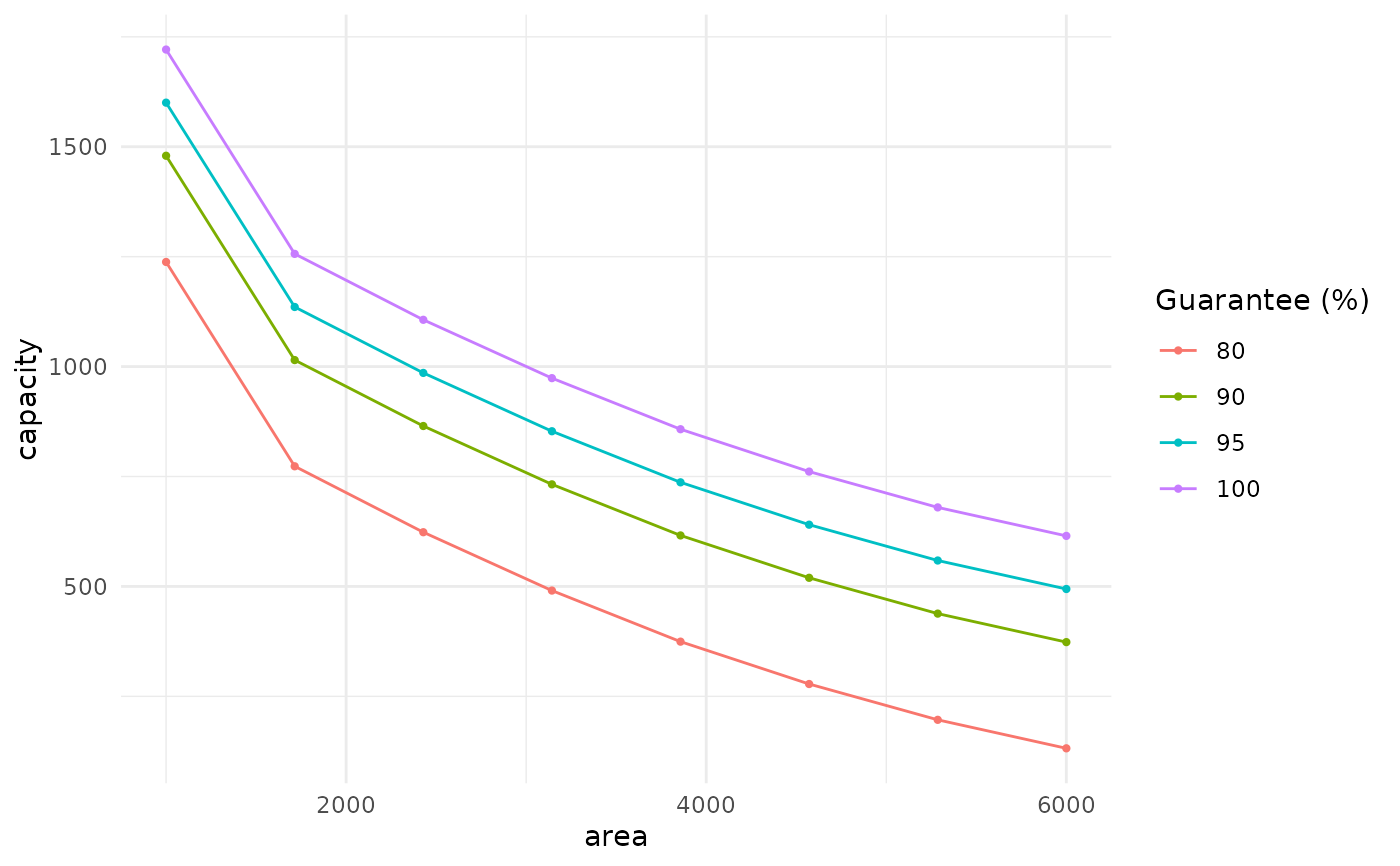
Draws the family of iso-guarantee curves from rh_iso_curve(): one line per
target guarantee level relating two design levers (e.g. area on the x-axis and
the reservoir capacity needed on the y-axis). Reading along a line shows how to
trade one lever for another while keeping the guarantee fixed. If the curve was
built with a by variable, it is shown as facets.
Arguments
- iso
A data frame from
rh_iso_curve().
Examples
iso <- rh_iso_curve(
  precip_pi$value, base = list(demand = 6.6, runoff = 0.85, efficiency = 1),
  x = "area", x_values = seq(1000, 6000, length.out = 8),
  y = "capacity", levels = c(80, 90, 95, 100),
  dates = precip_pi$date, climatology = TRUE
)
if (requireNamespace("ggplot2", quietly = TRUE)) rh_plot_iso(iso)