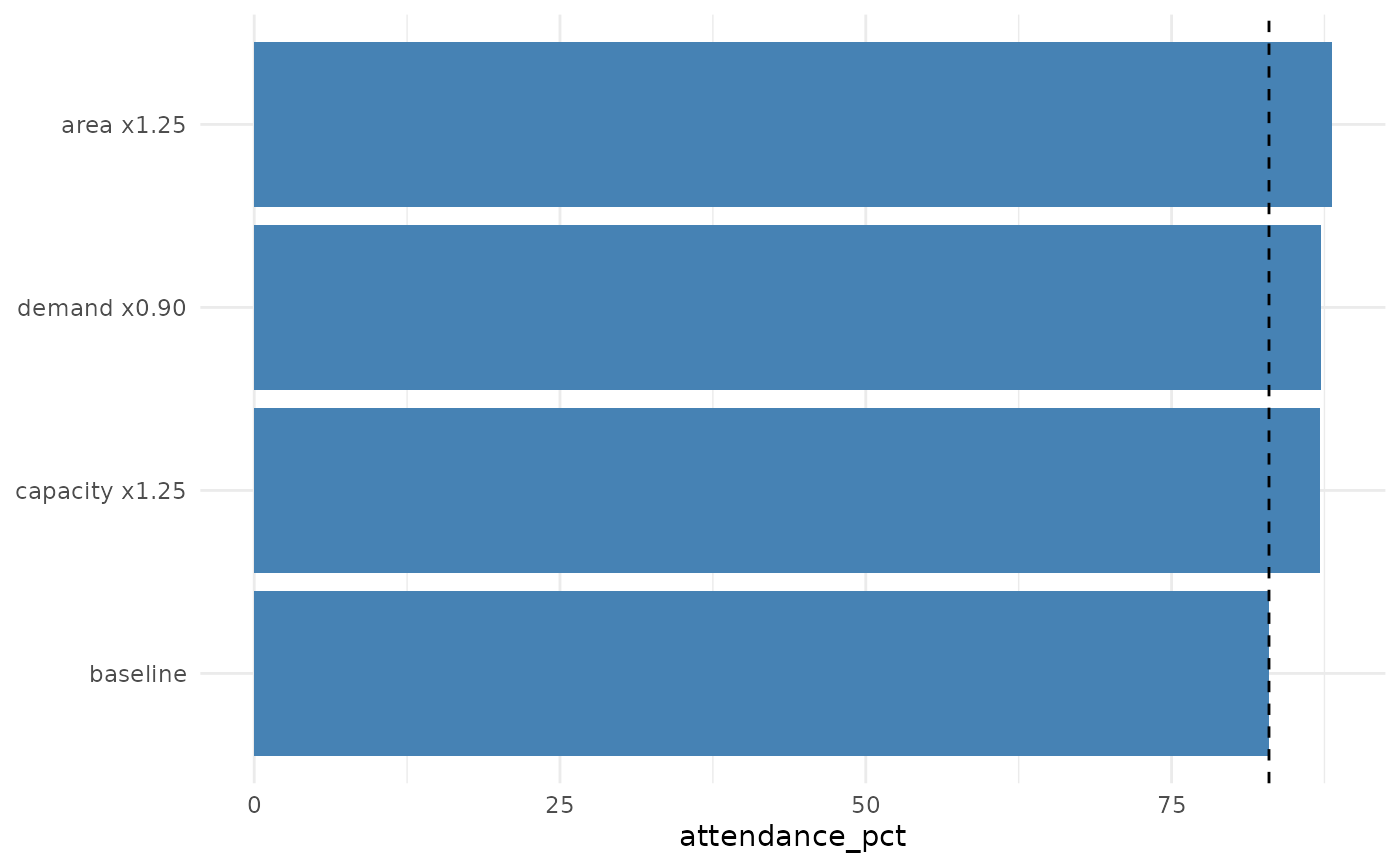
From a chosen operating point, applies a multiplicative change to each lever (catchment area, reservoir capacity and demand) one at a time and shows the resulting performance metric, with a dashed line at the baseline, so that enlarging the roof, enlarging the tank and trimming demand can be compared directly.
Usage
rh_plot_levers(
  precip,
  base,
  changes = list(area = 1.25, capacity = 1.25, demand = 0.9),
  metric = "attendance_pct",
  dates = NULL,
  climatology = FALSE
)
Arguments
- precip
Numeric vector of daily precipitation (mm). If
climatology = TRUE, it is first collapsed to its day-of-year mean (seedates).- base
Named list with the operating point (must include the levers to be changed, e.g.
area,capacity,demand).- changes
Named list of multiplicative factors applied to each lever in turn, e.g.
list(area = 1.25, capacity = 1.25, demand = 0.9).- metric
Single metric to compare (default
"attendance_pct").- dates
Optional date vector aligned with
precip, required only whenclimatology = TRUE.- climatology
If
TRUE, simulate on the day-of-year climatology (much faster) instead of the full series. DefaultFALSE.
Examples
if (requireNamespace("ggplot2", quietly = TRUE)) {
  rh_plot_levers(
    precip_pi$value,
    base = list(demand = 6.6, area = 4170, capacity = 400,
                runoff = 0.85, efficiency = 1),
    dates = precip_pi$date, climatology = TRUE
  )
}