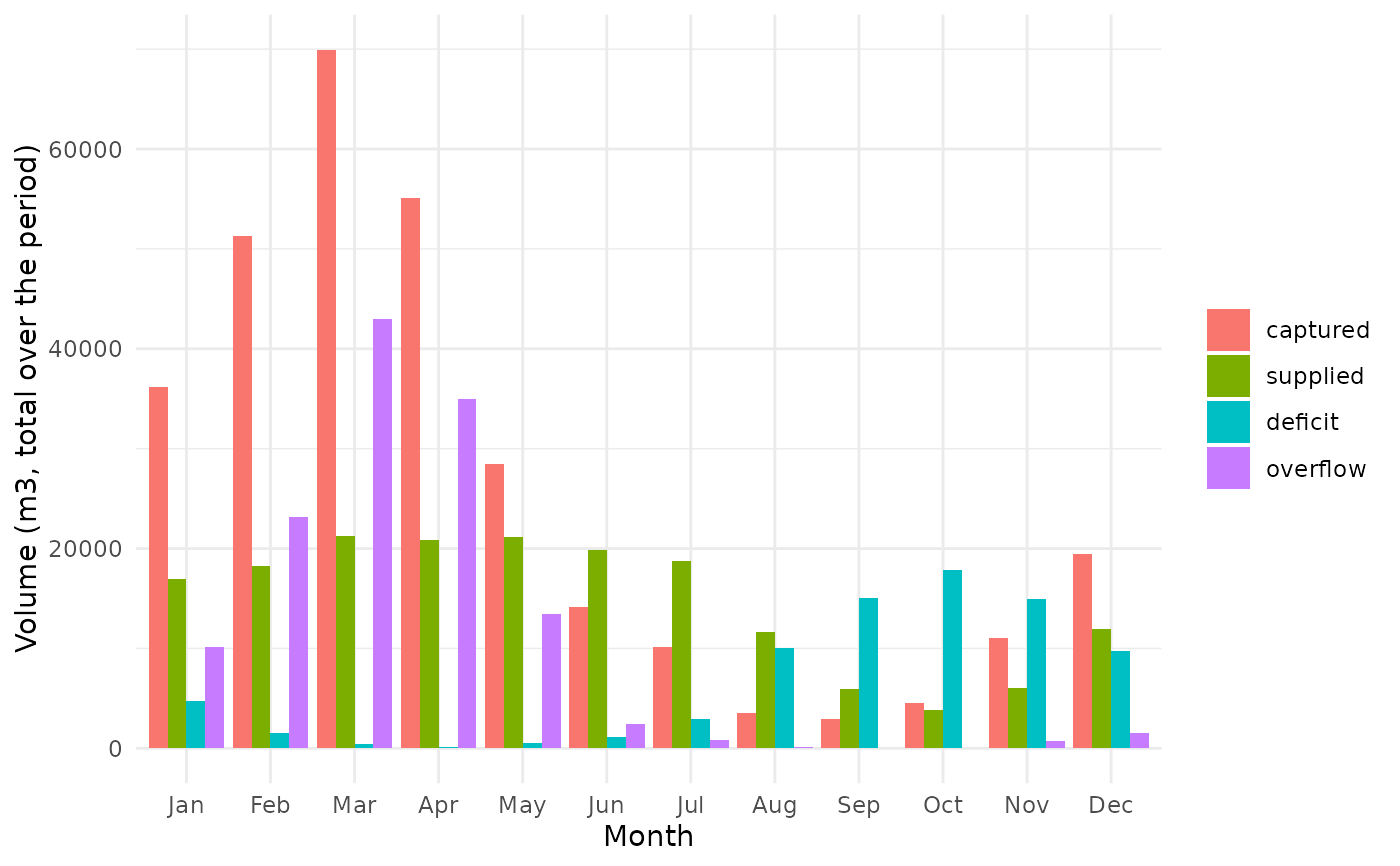
Aggregates the simulation to calendar months and draws grouped bars of the
main fluxes (captured, supplied, deficit, overflow) to expose seasonal
shortfalls. Requires dates because the simulation series is indexed by step,
not by date.
Usage
rh_plot_monthly_balance(
  sim,
  dates,
  vars = c("captured", "supplied", "deficit", "overflow")
)Examples
sim <- rh_simulate(precip_pi$value, demand = 6.6, area = 4170, capacity = 400,
                   runoff = 0.85, efficiency = 1)
if (requireNamespace("ggplot2", quietly = TRUE)) {
  rh_plot_monthly_balance(sim, dates = precip_pi$date)
}