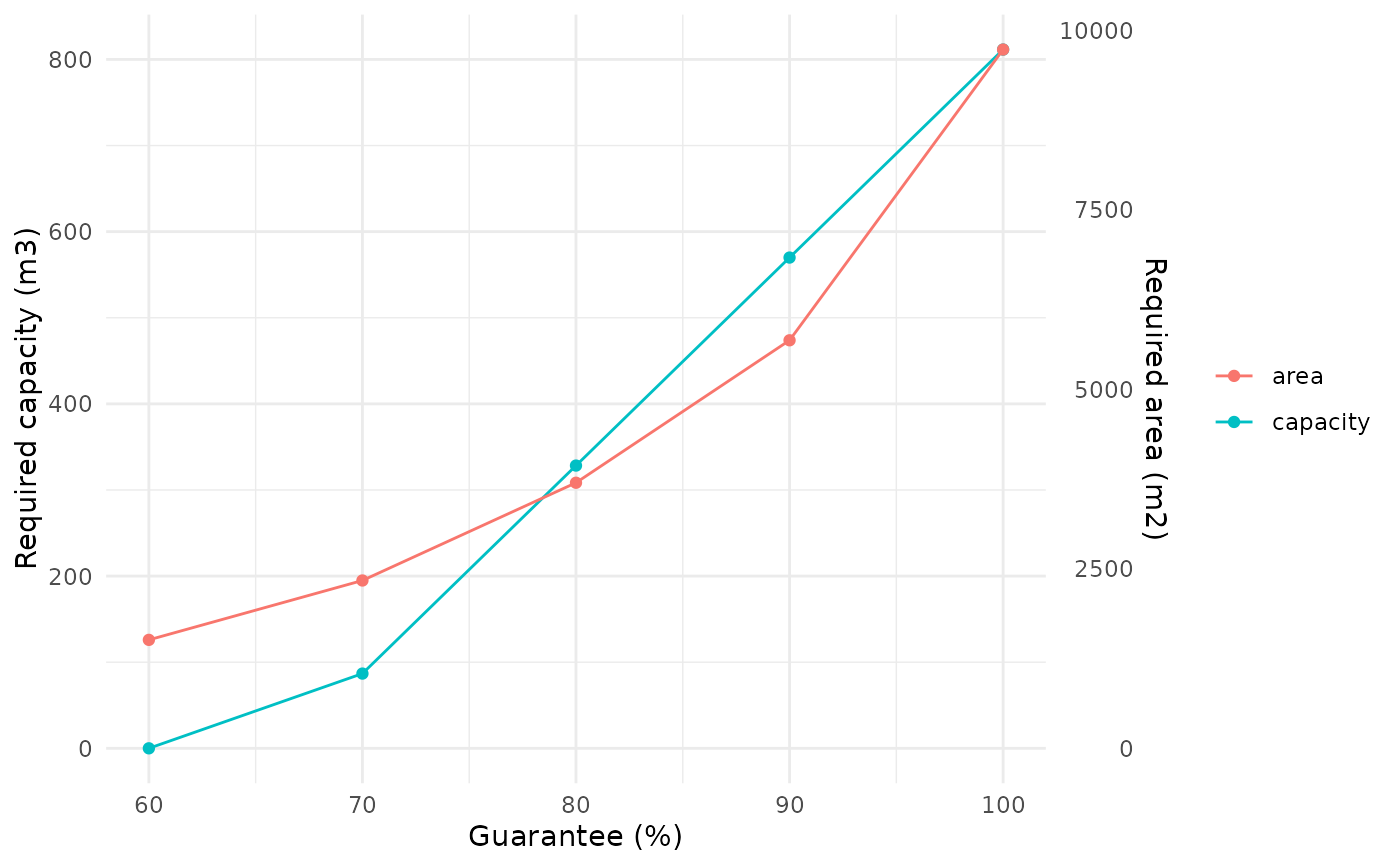
Draws the output of rh_resource_curve() as a guarantee "design curve":
guarantee level on the x-axis, with the required resources on the y-axis. For
exactly two resources (the default capacity + area) it uses a dual y-axis,
echoing the reservoir stage-area-volume curve; otherwise it facets.
Arguments
- rc
A data frame from
rh_resource_curve().
Examples
rc <- rh_resource_curve(
  precip_pi$value,
  base = list(demand = 6.6, area = 4170, capacity = 400,
              runoff = 0.85, efficiency = 1),
  levels = seq(60, 100, by = 10),
  dates = precip_pi$date, climatology = TRUE
)
if (requireNamespace("ggplot2", quietly = TRUE)) rh_plot_resource_curve(rc)