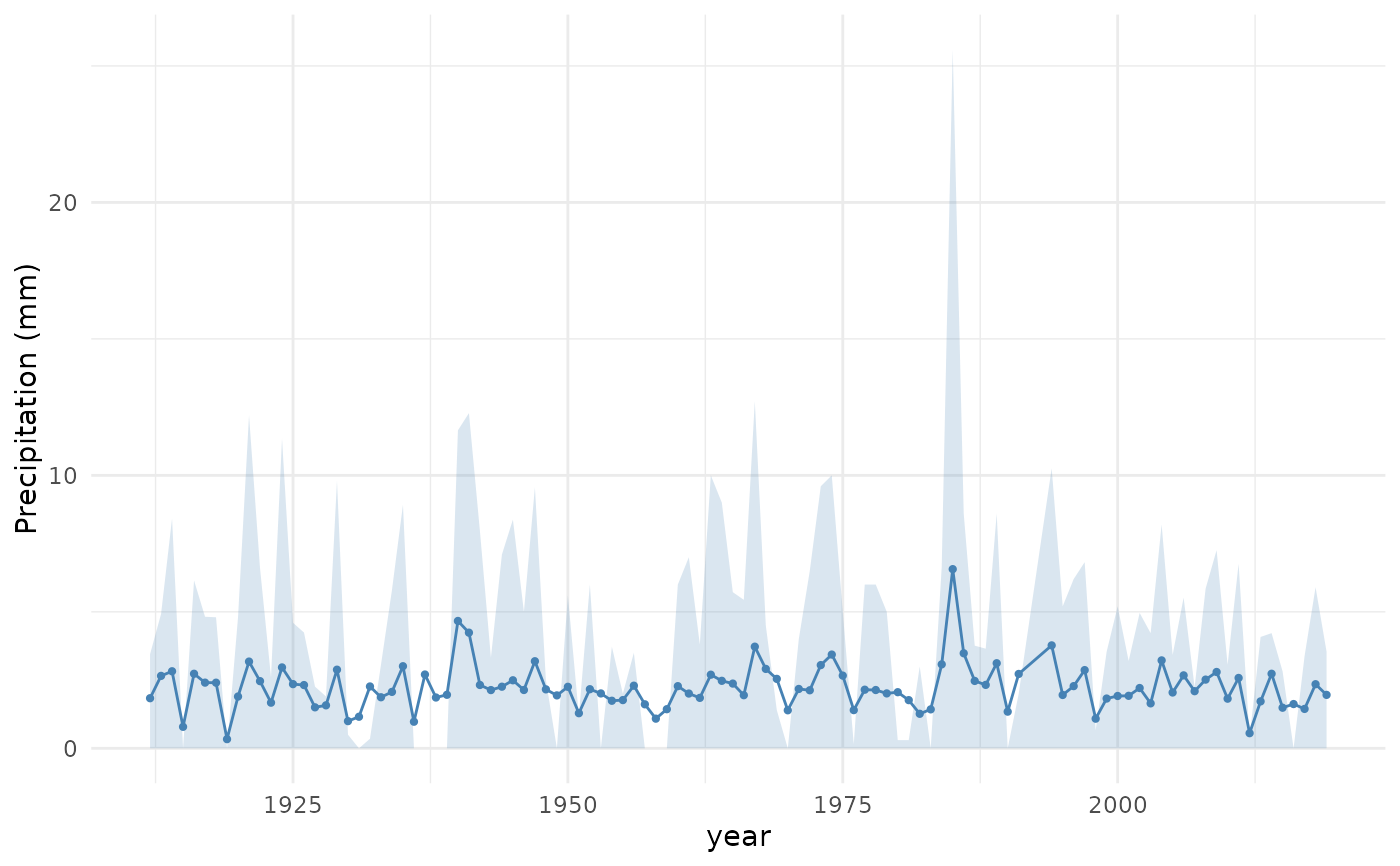
Draws the output of rh_series_spread(): the mean per group with a shaded
10th-90th percentile band, highlighting how variable the rainfall is across
years (or months/days of the year).
Arguments
- spread
A data frame from
rh_series_spread().
Examples
sp <- rh_series_spread(precip_pi, by = "year")
if (requireNamespace("ggplot2", quietly = TRUE)) rh_plot_spread(sp)