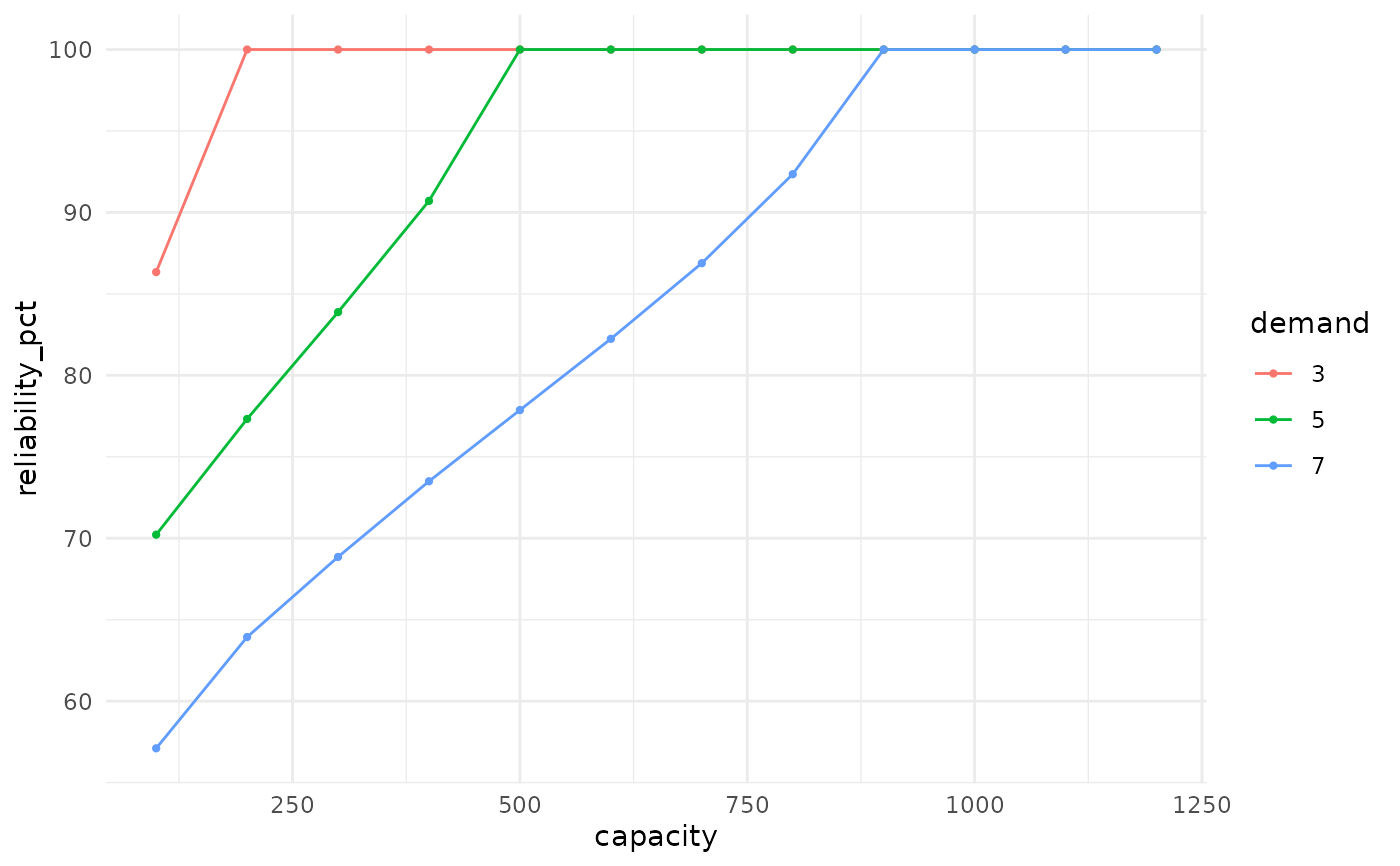
Plots a performance metric against one design variable (typically reservoir capacity on the x-axis), with one line per value of the other variable (typically demand or area). This is the classic Storage-Yield-Reliability (SYR) view used in rainwater-tank design (e.g. McMahon & Adeloye; Fewkes; Mitchell).
Arguments
- grid
A data frame from
rh_grid(): the x-attribute becomes the x-axis and the y-attribute becomes the colour (one line per value).- metric
Which metric column to plot; default the first in
grid.
Examples
g <- rh_grid(precip_pi$value, base = list(runoff = 0.85, efficiency = 1, area = 4170),
             x = "capacity", x_values = seq(100, 1200, length.out = 12),
             y = "demand", y_values = c(3, 5, 7),
             metrics = "reliability_pct",
             dates = precip_pi$date, climatology = TRUE)
if (requireNamespace("ggplot2", quietly = TRUE)) rh_plot_syr(g)