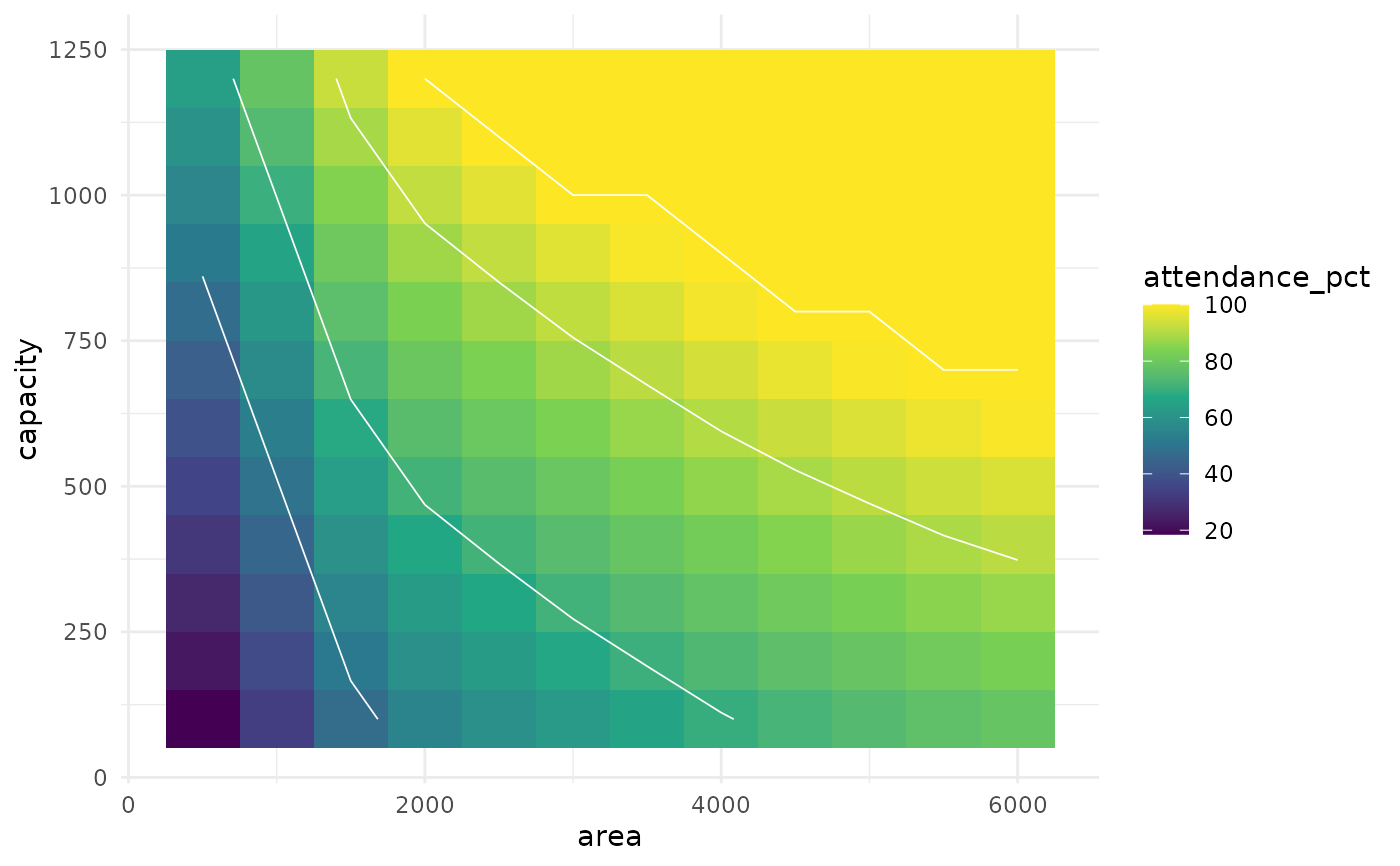
Trade-off surface: catchment area vs reservoir capacity
Source:R/plot-tradeoff.R
rh_plot_tradeoff.RdDraws the performance surface produced by rh_grid() as a heatmap with
iso-performance contours. With area on the x-axis and capacity on the y-axis
(the defaults), it shows whether enlarging the roof or the tank moves
the system across a target guarantee level faster. The demand (and any other
parameter) is whatever was fixed in the base of rh_grid().
Arguments
- grid
A data frame from
rh_grid().- metric
Which metric column to display; defaults to the first metric in
grid. Typically"attendance_pct"(volumetric) or"reliability_pct"(time-based).- contours
Logical; overlay iso-performance contour lines. Default
TRUE.- breaks
Numeric contour levels (e.g.
c(80, 90, 95, 100)for a percentage metric). DefaultNULL(automatic).
Examples
g <- rh_grid(precip_pi$value,
             base = list(demand = 6.6, runoff = 0.85, efficiency = 1),
             x = "area", x_values = seq(500, 6000, length.out = 12),
             y = "capacity", y_values = seq(100, 1200, length.out = 12),
             metrics = "attendance_pct",
             dates = precip_pi$date, climatology = TRUE)
if (requireNamespace("ggplot2", quietly = TRUE)) {
  rh_plot_tradeoff(g, breaks = c(50, 70, 90, 100))
}