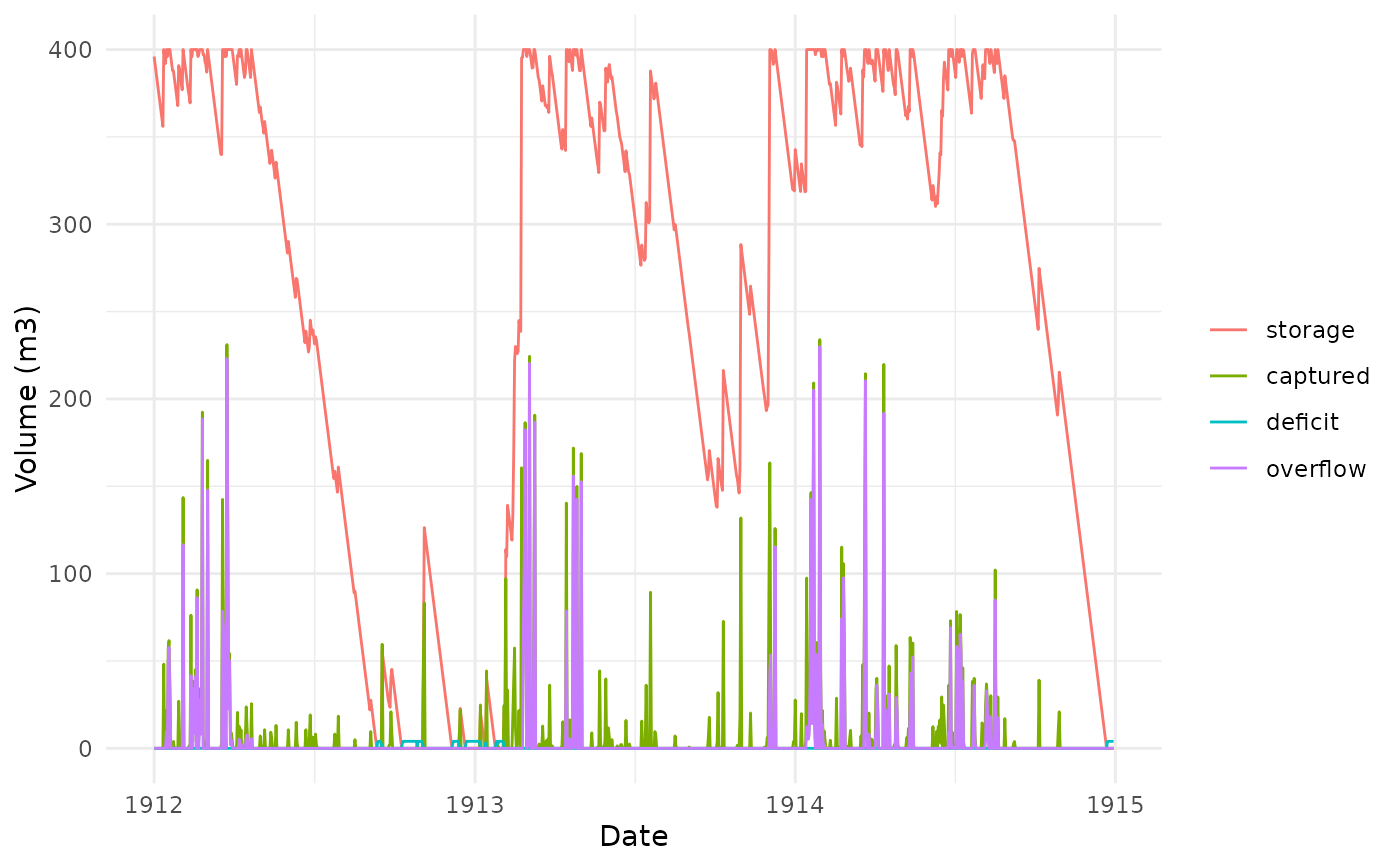
Plots the daily series of a rh_simulate() result (storage, captured inflow,
deficit, overflow, supplied). A richer companion to autoplot.rharv_sim():
it can show more variables and use real dates on the x-axis.
Usage
rh_plot_behaviour(
  sim,
  dates = NULL,
  vars = c("storage", "captured", "deficit", "overflow")
)Examples
sim <- rh_simulate(precip_pi$value[1:1095], demand = 4, area = 4170,
                   capacity = 400, runoff = 0.85, efficiency = 1)
if (requireNamespace("ggplot2", quietly = TRUE)) {
  rh_plot_behaviour(sim, dates = precip_pi$date[1:1095])
}